Version 2.3.1 is the newest version of DataGraph
Download DataGraph for OS X 10.4
Download DataGraph for OS X 10.5
April 18th 2010.
There are three main changes, the Connect command a search function and support for multi-line text everywhere. There are numerous other fixes, improvements and tweaks.
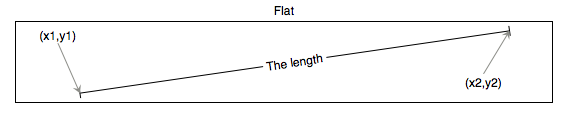
Connect command:
Draws a one or more lines between given points. Specify the lines by giving the starting position (x1,y1) using single values or up to two columns, and the ending position (x2,y2) using values or two columns. Can use this for a number of different cases. You can use this to draw a line or an arrow between two points, to draw multiple lines/arrows. You can attach a label to each line and vary the line color based on a column.
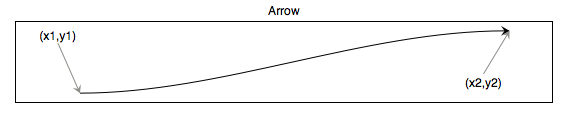
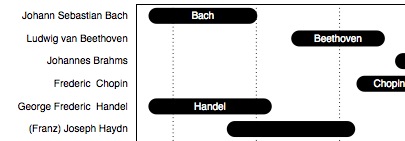
You can draw multiple lines as well, for example as a Gantt chart.
Search:
Pressing Command-F brings up a small search strip above the table. This is similar to what recent Apple apps do.
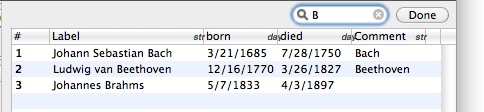
The search filters your rows, but does not affect the result. You can still change entries, delete, copy etc.
Multi-line text:
Up to this point, the Text command was the only way to create a multi-line label, axis title etc. Now there is another way.
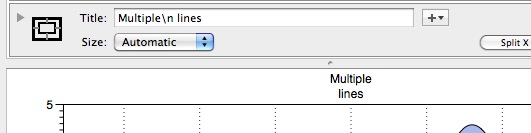
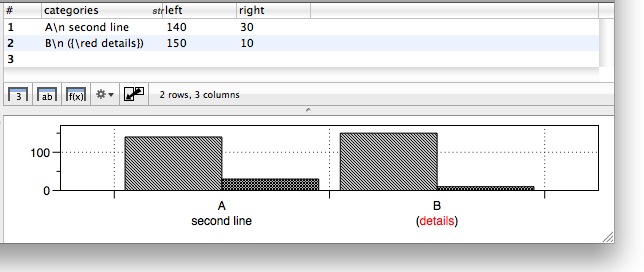
\n followed by a space triggers a new line. This can be used in all drawing commands, and even for tick marks if the labels contain a “\n ”. The legend command will also allow you to use multiple lines each item description.
Other improvements:
Tweaked the cropping floater, so that on a laptop, mighty mouse or magic mouse you can use the scrolling feature to zoom in/out and translate the zoom.
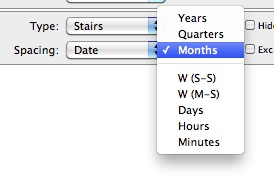
You can now use date based binning in histograms. If the data column is a date column the Automatic option will pick a date based bin.
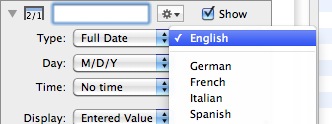
The date column is now better at understanding international dates. This means that you can use German, French etc to specify the input format. This can also be used for the display format.
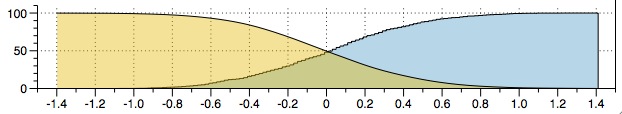
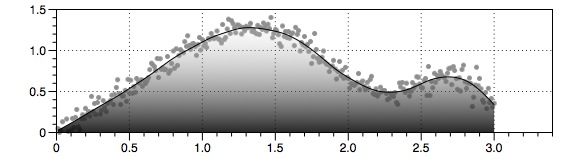
Added a CDF (cumulative distribution function) option for the histogram command. Standard means a histogram.

Works also for the smooth version (kernel density estimate)
Modified the magnify command slightly. If the range specified in the magnify command is larger than the cropping region the inset view has a larger domain than the drawn view. To reflect that a small rectangle is drawn inside the magnified portion which represents the cropping region.
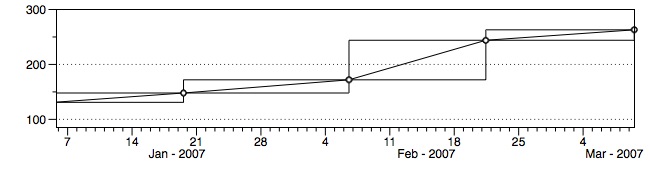
For the Plot command and Plots command, added a Step option. So now there are four options. Smooth (not drawn here) Line (default) and Step (two options). Intended data where the change is assumed to be abrupt at a particular value.
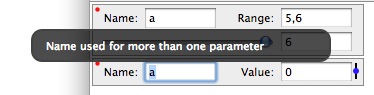
Error notifications:
In the interest of eliminating as many modal dialogs as possible, error messages are handled in a less modal fashion with floating windows. So when you for example type in a variable name that will cause an error condition, you get a floating error message right above the field you were typing in. This will allow you to fix things without having to chase down an OK button somewhere.
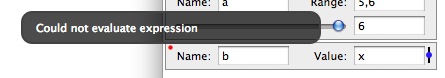
If you click with the mouse the window will go away, but there is also a red dot to indicate that there is an error here. If you click on the red dot. For example if the value is invalid
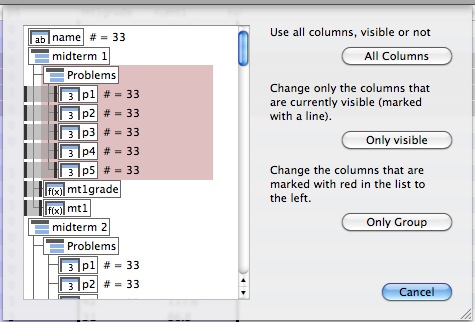
When you only display a portion of the data and drag/remove rows, it is not always clear what columns should be affected. Up to this point, only the visible columns were affected and the hidden columns stayed the same. This is a WYSIWYG approach, but not always what you have in mind. The workaround was to display everything, drag and then hide things again. To avoid that, when there is an ambiguity a sheet drops down and gives you options regarding what you meant.
Added a fill option for the fit command.
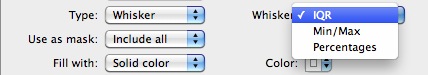
Added more options for the Box and Whisker part of the Box command. IQR is the old style, Min/Max puts bars at the min/max data point, and Percentages allows you to specify where the bars are.
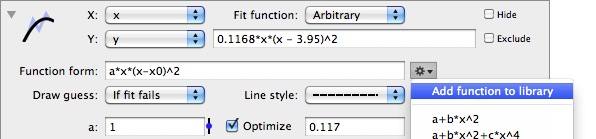
The fit command now has a method to define a library of functions. Can add a function and if a library function is the same as the specified function instead of adding the function the menu allows you to remove the function.
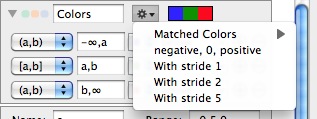
The color map is now more compact, and shows the colors to the right.
Another improvement is that you can now ask it to automatically suggest mask options. The choices are based on the columns that are used as a mask inside drawing commands.
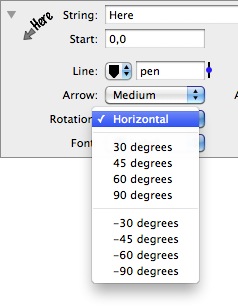
Added an option to the Label command to rotate the text
When you drag a file into the column list, DataGraph creates a group to house the file. If you then drag another file onto the group the content of the group is overwritten.
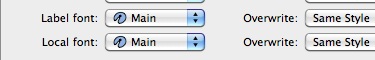
Added a new font definition into the style settings. This makes it easier to use a special label font etc.
New point styles
Bug fixes/Tweaks:
File importing and pasting is improved. In particular will handle quoted text better.
Context menu issues in the drawing window and some commands.
Table group colors are handled better. You only specify the color for the top group, and nested groups are drawn in darker and darker shades.
Improved drawing functions that have asymptotes such as 1/x.
Improved Cricket Graph III import.
Automator now works properly in 10.6.
Fixed SVG issue with line widths.
Added X Intercept to a the linear fit (=-Intercept/Slope) and the x intersection points for a quadratic (X0, X1).
More hash patterns. Used to be two, added a finer option.
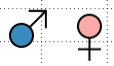
Added Male/Female markers.
For the Range command, can now use a color scheme to vary the fill color.
New functions - sinc, rect, tri, H, sgn
Statistics for a histogram are computed even if the command is excluded.
dgraph now makes the -output and -script flags optional. That means that dgraph file.dgraph A B file.tiff will understand file.dgraph to be the template and file.tiff to be the output file.
Added more line styles.
When you scroll a data view I display the row numbers in a floating window above the table.
Added "Gill Sans" and "Gill Sans Light" to the font menu. They are installed in the system and look nice in a graph.