
DataGraph framework
The DataGraph framework is Cocoa framework that allows you to use the underlying drawing engine of DataGraph inside your own application
Download the framework (disk image)
If you do not have a DataGraph license, you can still try out the framework, but you get a watermark on all your graph views. If you have a license for the DataGraph application, this watermark is not displayed and exporting is enabled.
This also means that if someone else that does not have a DataGraph license uses your application they will get the watermark. In order to remove this watermark for distributed applications either every user needs a DataGraph license or you ask for a separate framework license.
There are several different use cases:
- Each user relies on their own DataGraph app license.
- For distributing academic apps that are closed source, buy a framework license ($400).
- For in-house apps, and this is defined as limited to a single company or organization, buy a license ($400) if the first option is not worth it.
- For open source apps, request an open source license. This removes the watermark that unregistered users see.
- For a commercial application, you need to send e-mail to discuss your use and support requirements.
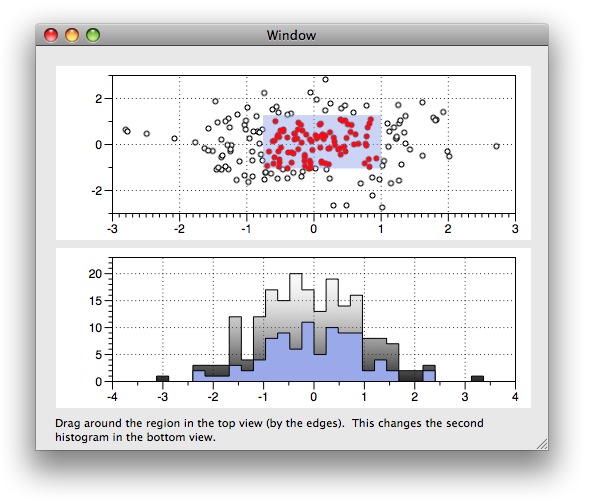
The DataGraph framework uses the same graphics engine as DataGraph, which is very robust and tested. DataGraph uses the framework, and a growing number of applications use the framework. The API is under development, and is guided by user feedback. The framework support a number of use cases such as real time graphics, thread support, interactivity and growing delegate support. If you download the framework, there are a number of sample projects that show how you can use it.
To get help, use the help system from within DataGraph, participate on the discussion board or send e-mail.
Quick Description
The DataGraph framework is not a standard plotting library, which typically expect you to master a number of functions and methods before anything shows up on the screen. The DataGraph framework allows you to use the DataGraph application to lay out the graph, and then you load the graph file in directly in your code. In some ways this is similar to what the Interface Builder is to user interfaces for Cocoa apps. All you have to do is to overwrite the data and the framework handles the rest, just as if you were in DataGraph. You can drill into the details and create things programmatically, but that is optional and only needed when you want to add/change drawing commands or get callbacks from the drawing commands.
Example:
Take for example a simple project where you want to draw a simple xy plot from data that you have stored in two lists. This is one of the sample projects - “Basic Script.xcode”.
To start you create a controller and load in the DataGraph file that you want to use.
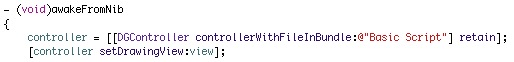
You can create an empty controller in Interface Builder and connect the drawing view there. If you have, then all you have to do is to overwrite the content of the controller with the DataGraph file. Then you overwrite the content of data columns in the controller with your data. The following example uses a list of strings, and the framework will handle the parsing.
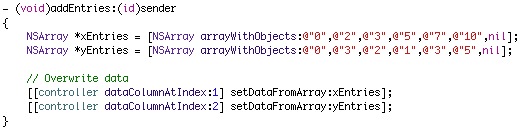
The fastest way is to use binary columns (a column type in DataGraph) and set/append the data using raw pointers. This is all that is needed, during the next screen redraw the graph is redrawn based on the new data.