
If this opens up automatically when you launch DataGraph, it is because you are using an older version.
Download the latest version of DataGraph
Release date - 3/13/14.
Most important additions:
Pivot Table command:
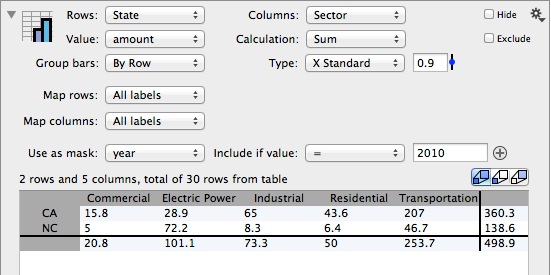
This is a Pivot table with a twist. It combines a pivot table and a bar graph drawing method. If you want to use the table result elsewhere you can extract the columns from the command by using the small gear menu in the top right. Another twist is that you can specify how you categorize the columns that give you the rows and columns of the pivot table.
This command is part of the evolution of DataGraph to become a statistical and analytical tool in addition to a drawing program.
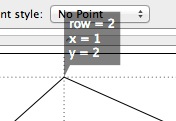
Hover information:
You can turn on a hover (Window menu). This shows information about drawing entries that are right under the mouse, like values of points etc. This should make it easier to view the data numerically as well as graphically. You can toggle this on and off with a keyboard shortcut.
Graphs:
Can now assign labels to graphs. Good for organization and when exporting images.
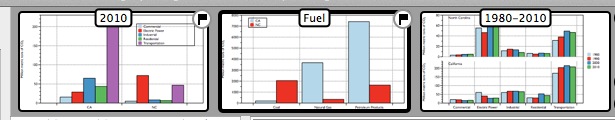
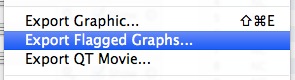
When you have named and flagged graphs you can export them all at the same time. Just specify the folder, and the names are based on the graph names.
Import special:

A new way to import ascii files. Useful when you want to import files that have a complicated format. You can skip over lines, use fixed space width for importing, specify mappings that need to be performed during the import etc. And then save this as filters that you can use later and in other files.
Style settings:
Added a way to specify the stride pattern for lines
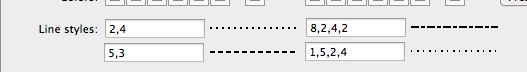
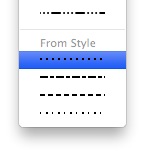
at the bottom of the line style menu you can now select which of these lines to use. That means that in addition to the default line styles you can specify four new styles.
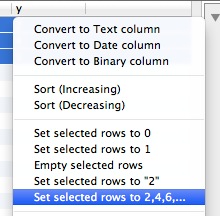
- Select row: Use Command-L to bring up this window:
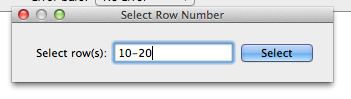
You can type in ranges or individual numbers, separated by commas. For example:
1,5,10
1-40
5:end
1:2:end - all odd rows
And combine this, i.e. 1,4,6,10:10:1000,end-5:end
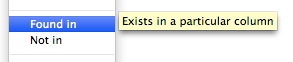
Mask: Added two new options. Can specify a column that should be searched.
Axis numbers: The default axis tick marks now has options to control the format of the numbers. Scientific uses exponents for all numbers. Engineering uses powers that are multiple of 3, and has an option to use prefixes. So 0.001 becomes 1m, 23000 becomes 23k etc. Group 1000’s is for currency type formats such as 1234.5 becomes 1,234.5.
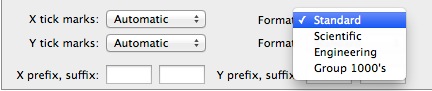
This is also available for the split axis and extra axis.
Commands that were tweaked:
- Bar : changed this quite a bit. Now it is more like the Bars command. Basically a new command, and there are some features of the old command that are not supported any more (left stairs), but that’s minimal. You can now specify a mask, vary the color based on a column, specify colors for positive/negative.
- Box : Can use a string column for locations. This will break the values up by categories and put the categories on the axis. Can draw the median as a numerical value.
- Stock : Can specify the fill color separately from the line color.
- Range : Can choose between a vertical and horizontal gradient fill.
- Points : More marker types. Can specify a uniform label
- Histogram : Can pick a hover label. This way you can see a label for every entry that is in a particular bin.
- Axis : A number of spaces can now be specified exactly and not just “wide/narrow/...”
LaTeX:
Added
\ell, \R, \Z, \C, \Q, \partial, \lnot, \land, \lor, \equiv, \oplus, \otimes, \oslash, \top, \bot, \vdash, \models, \dashv, \dag, \ddag, \doteq, \emptyset
Formatting:
Improved formatting for the axis. You can now specify the formatter for the standard axis. In particular the engineering format, which allows you to format 1500 as 1.5k and 1500000 as 1.5M etc.
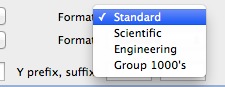
This also applies to the extra axis.
Expression column:
The expression column can now refer to columns using a path like syntax like ./x, ../group/x /topgroup/x By default the expression column uses a search path
Functions: Used in every numerical field, but typically this will affect the expression column
Date support hour(), minute(), isAM(), isPM(), dayofweek() : Input is seconds from 1/1/970.
second() is a function that takes in arguments like year,month,day or year month,day,hour,minute and returns the epoch time
Drawing group:
Added a new option to the drawing group:
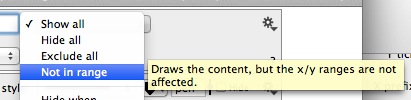
This draws the content without affecting the range. This is useful when you want to draw something in the background by using drawing commands.
UI:
Context menus for more than just the columns
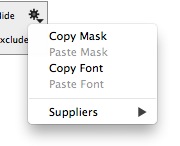
Client/Supplier menus allow you to see which entries use a particular variable, column or command. This is very useful when you have complicated files.
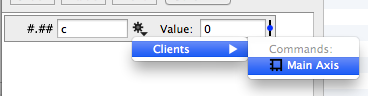
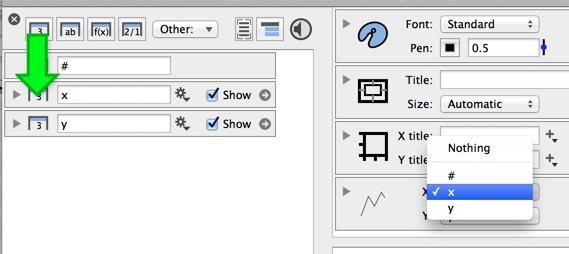
The bouncing green arrow. As files get more complicated it can be hard to understand how something is put together. For example when you haven’t looked at the file for a few months. The Clients and Suppliers action in the context menu is meant to address that, since you can drill down and see where things are coming from or if a particular column is used anywhere. The green arrow shows up in two places, when you select a menu for client/supplier, and when you hover over a column selection. Essentially, DataGraph assumes that since you hesitate you are wondering which entry you should pick, and then the green arrow shows up to point out where the column is. The lag should mean that it is not constantly popping up.
When you add a new command, column or variable it gets added after the last selected entry.
Data table:
The context menu was beefed up a little bit. When you control click on a cell:
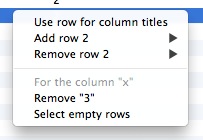
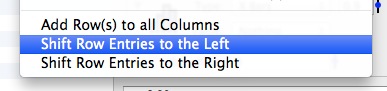
When you control click on the column header
You can shift a selection left/right, for example if an import didn’t quite work like you wanted (TextEdit can corrupt some tables)
SVG:
SVG export now embeds bitmaps.
Bugs:
Bugs were squashed, and 3.2 stayed in beta for a long time, so hopefully bugs in the new features have all been found and fixed. But if something pops up, please report it.
There were some small bugs in the import, specially related to unicode characters.
The crop marks in printing are now dealt with better. Before it didn’t remember the settings properly.
Fixed issues when you used a mapped Text column inside an expression column.
Mirrored tick marks now draw a lot better.
Tweaks:
A lot of small nips and tucks throughout. Optimized a number of actions, which should be noticeable when you have large files.